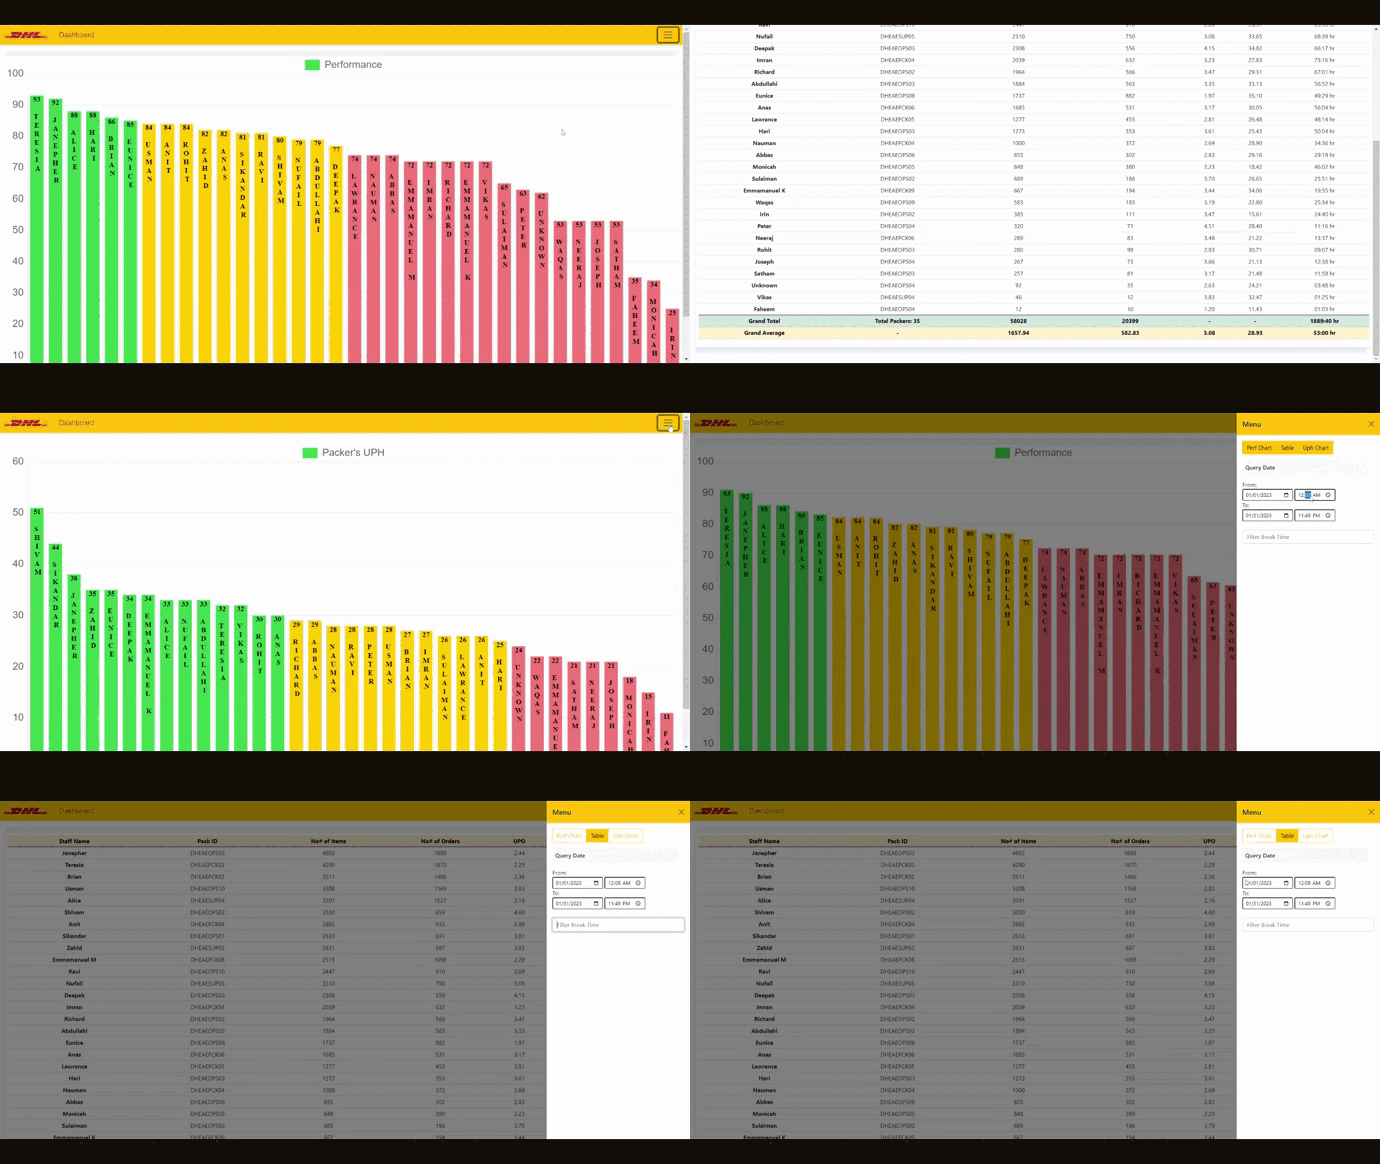
Project Overview
The Employee Productivity Dashboard is a cutting-edge tool built with the latest JavaScript technology to help boost workplace productivity and efficiency. It features a user-friendly design for real-time tracking and analysis of employee performance, including a Performance Chart for visualizing individual performance over time, a UPH (Units Per Hour) Chart to monitor productivity, and a Data Table offering detailed insights into work hours, items processed, and orders completed. This dashboard has significantly benefited organizations by enabling data-driven decisions that improve operations and employee productivity.

Technology Stack
Cutting-edge technologies and tools that power this project
JavaScript
Core Development Language
Chart.js
Data Visualization
HTML5
Structure & Layout
CSS3
Styling & Design
Data Analytics
Performance Metrics
Real-time Updates
Live Data Tracking
Stack Overview
This project leverages a modern tech stack combining 6 powerful technologies to deliver exceptional performance, scalability, and user experience.
Key Features
Innovative features that make this project stand out from the crowd
Performance Visualization
Interactive performance charts for visualizing individual employee performance over time with trend analysis and performance indicators.
UPH Monitoring
Units Per Hour (UPH) tracking and visualization to monitor productivity levels with real-time updates and historical data analysis.
Detailed Analytics
Comprehensive data tables with detailed insights into work hours, items processed, orders completed, and performance metrics.
Real-time Tracking
Live data tracking and updates for immediate performance monitoring and real-time productivity assessment capabilities.
Performance Recognition
Employee recognition system highlighting top performers and achievements to boost motivation and workplace productivity.
Responsive Design
Mobile-friendly responsive design ensuring optimal dashboard access across all devices and platforms for maximum usability.
Feature Highlights
These 6 key features work together to create an exceptional user experience, combining functionality with modern design principles.
Development Journey
Key milestones and phases that shaped this project from concept to completion
Requirements Analysis
Conducted thorough analysis of DHL's productivity tracking needs, identified key performance indicators, and designed the dashboard architecture.
Data Visualization
Implemented interactive charts and graphs using Chart.js for performance visualization, UPH tracking, and trend analysis capabilities.
Real-time Features
Added real-time data updates, live performance tracking, and automatic dashboard refresh for immediate productivity monitoring.
Deployment & Recognition
Deployed the dashboard to production, achieved Employee of the Month recognition for outstanding contribution to workplace productivity.
Code Spotlight
Performance chart implementation with real-time data updates
// Performance Chart Implementation
class PerformanceChart {
    constructor(canvasId, data) {
        this.ctx = document.getElementById(canvasId).getContext('2d');
        this.chart = new Chart(this.ctx, {
            type: 'line',
            data: {
                labels: data.labels,
                datasets: [{
                    label: 'Performance Score',
                    data: data.performance,
                    borderColor: '#22c55e',
                    backgroundColor: 'rgba(34, 197, 94, 0.1)',
                    tension: 0.4,
                    fill: true
                }, {
                    label: 'Units Per Hour',
                    data: data.uph,
                    borderColor: '#3b82f6',
                    backgroundColor: 'rgba(59, 130, 246, 0.1)',
                    tension: 0.4,
                    fill: true
                }]
            },
            options: {
                responsive: true,
                interaction: {
                    intersect: false,
                },
                scales: {
                    x: {
                        display: true,
                        title: {
                            display: true,
                            text: 'Time Period'
                        }
                    },
                    y: {
                        display: true,
                        title: {
                            display: true,
                            text: 'Performance Metrics'
                        }
                    }
                },
                animation: {
                    duration: 1000,
                    easing: 'easeInOutQuart'
                }
            }
        });
    }

    updateData(newData) {
        this.chart.data.datasets[0].data = newData.performance;
        this.chart.data.datasets[1].data = newData.uph;
        this.chart.update('active');
    }
}

// Real-time data update system
class DashboardManager {
    constructor() {
        this.updateInterval = 30000; // 30 seconds
        this.charts = {};
        this.initializeCharts();
        this.startRealTimeUpdates();
    }

    async fetchLatestData() {
        try {
            const response = await fetch('/api/performance-data');
            const data = await response.json();
            return data;
        } catch (error) {
            console.error('Error fetching performance data:', error);
            return null;
        }
    }

    startRealTimeUpdates() {
        setInterval(async () => {
            const latestData = await this.fetchLatestData();
            if (latestData) {
                this.updateAllCharts(latestData);
                this.updateDataTable(latestData);
            }
        }, this.updateInterval);
    }
}
Code Explanation
This code snippet demonstrates key functionality and implementation patterns used throughout the project.
Technical Challenges
Complex problems encountered during development and the innovative solutions that overcame them
Real-time Data Management
Challenge
Implementing efficient real-time data updates without performance degradation while maintaining accurate and synchronized dashboard information.
Solution
Developed an optimized data fetching system with intelligent caching, throttled updates, and efficient chart rendering for smooth real-time performance.
Performance Optimization
Challenge
Ensuring dashboard responsiveness and smooth performance while handling large datasets and complex visualizations simultaneously.
Solution
Implemented data pagination, lazy loading for charts, optimized rendering algorithms, and efficient memory management for enhanced performance.
User Experience Design
Challenge
Creating an intuitive and user-friendly interface that provides comprehensive analytics while remaining simple and accessible for all users.
Solution
Designed a clean, modern interface with progressive disclosure, contextual help, and responsive design principles for optimal user experience.
Ready to Explore?
Experience the project firsthand or dive into the source code to see how it all comes together. Your feedback and contributions are always welcome!